Research Themes
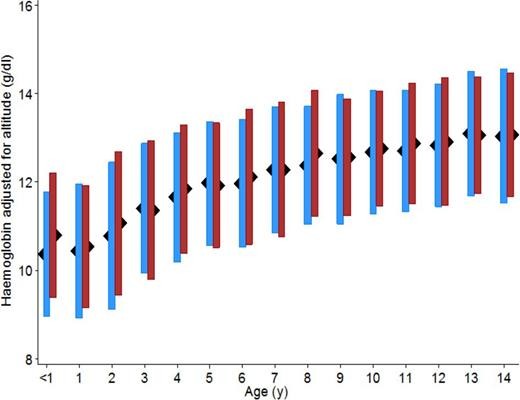
Anemia monitoring and intervention in school-aged children
The study examines the prevalence of anemia from school-based and house-hold surveys among children up to their 15th birthday sampled from 2008–2015 in Kenya. Anaemia has long been recognized as a major public health problem among young children in lower- and middle-income countries and is an indicator of both poor nutrition and health status. There […]
Read More
Research Themes
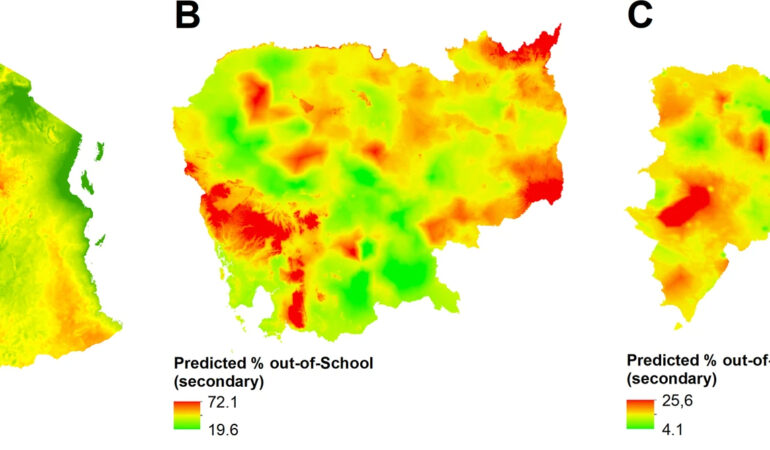
Mapping out-of-school adolescents and youths
Figure 1 Distribution of secondary schools in (A) Tanzania, (B) Cambodia, and (C) the Dominican Republic is used to estimate travel time of students. This is useful in exploring geographic variation in spatial access to schools by the youth and its influence on school attendance. Figure 2 Model based geostatistical methods were utilised to make […]
Read More
Research Themes
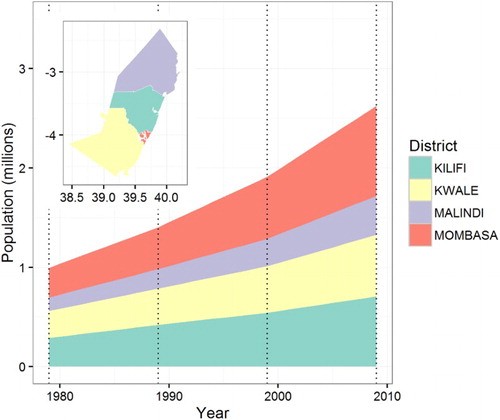
Modelling changing population distributions
The study used available settlement datasets, historical census data and developed population distribution modelling methods to reconstruct population distribution changes over 30 years across the Kenyan Coast, a data-scarce area characterized by high population growth rates. The methodological challenges and opportunities associated with the production of gridded population distribution time-series were explored.
Read More
Research Themes
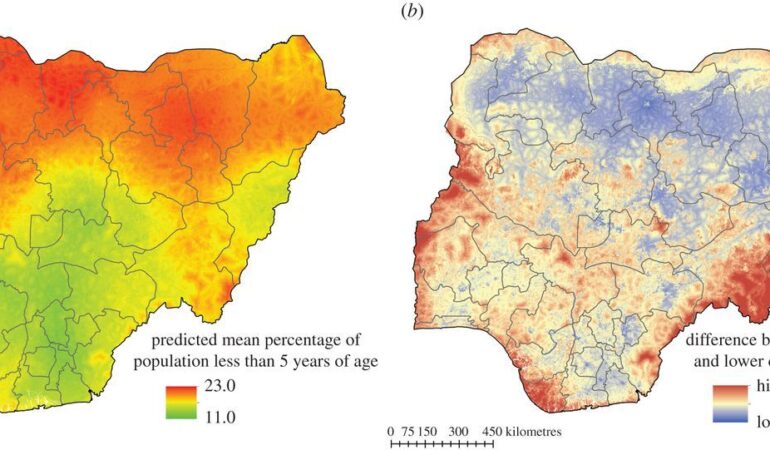
Fine resolution mapping of population age-structures
Using geolocated household surveys data to predict the proportions of population under 5 years, the results show that southern Nigeria had lower proportions of children under 5 as compared to the northern regions. For example, Kano, Katsina and Kaduna states had some of the highest proportions of population. The gaps in estimated number of bed-nets […]
Read More
Research Themes
Variation in patterns of febrile case management in sub-Saharan Africa
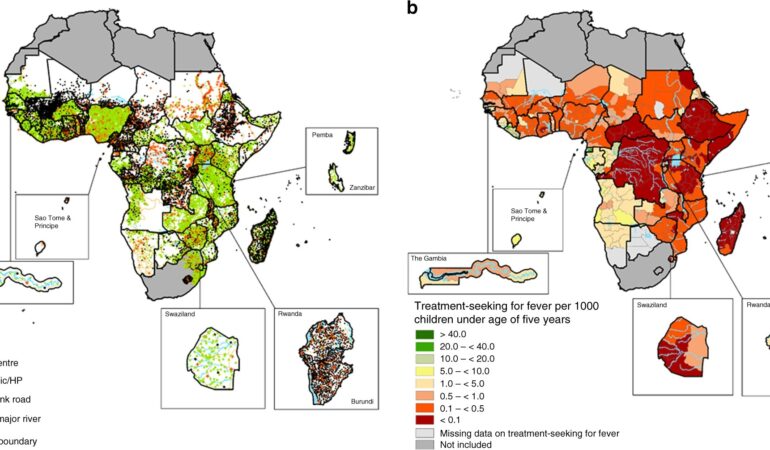
The study triangulated household survey data for fever in children under the age of five years with georeferenced public health facility databases (n = 86,442 facilities) in 29 countries across sub-Saharan Africa, to estimate the probability of seeking treatment for fever at public facilities. Given national healthcare coverage gaps, understanding treatment-seeking behavior for fever is crucial for […]
Read More
Research Themes
Access to emergency hospital care
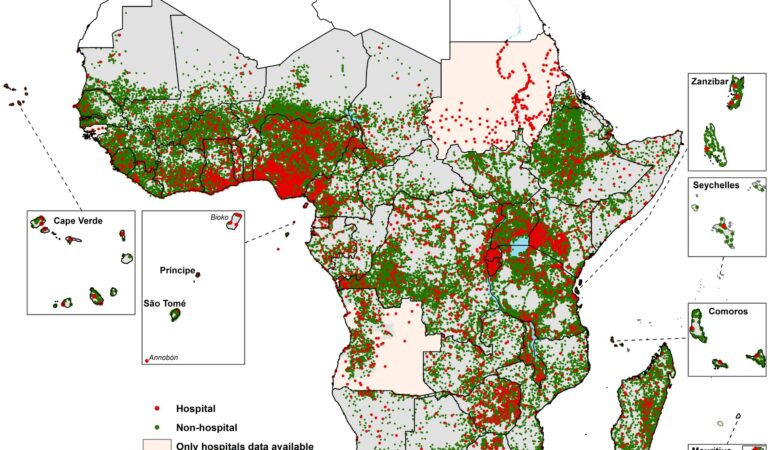
Timely access to emergency care can substantially reduce mortality. The paper aimed to complete a geocoded inventory of hospital services in Africa in relation to how populations might access these services in 2015, with focus on women of child-bearing age. A geocoded inventory of 4908 public hospitals across 48 countries and islands of sub-Saharan Africa, […]
Read More
Research Themes
Subnational estimates of factors associated with under-five mortality in Kenya
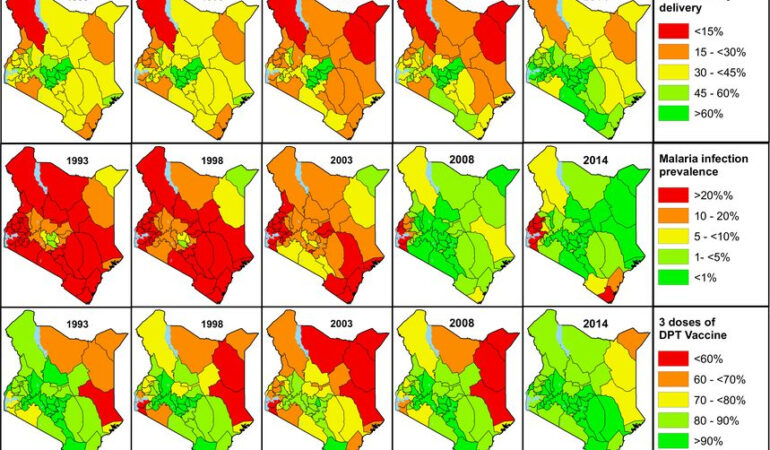
We gathered rich insights into child survival in Kenya by mapping patterns over 22 years. We set out to explore disparities and inequities by estimating the coverage and prevalence of 43 determinants. This we did for each of Kenya’s 47 counties every year between 1993 and 2014. These studies give granular insights into the situation in regions across […]
Read More
Research Themes
Under five mortality
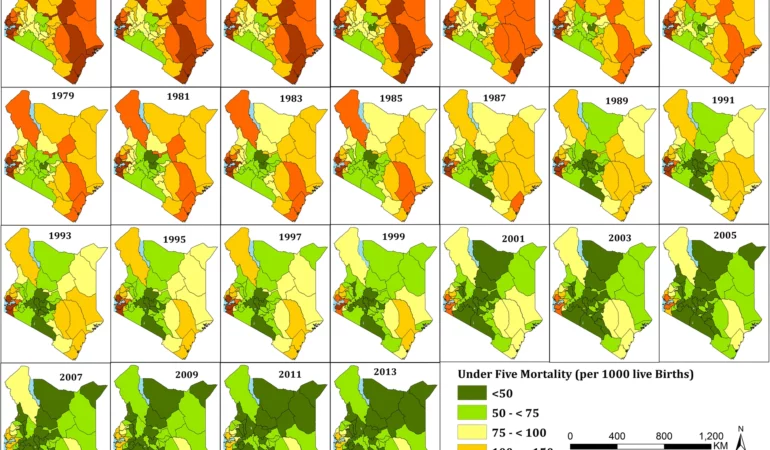
Trends in under-five mortality(U5M) in Kenya Vital statistics remain the bedrock for population and social policies providing a country’s decision-makers with critical information for resource allocation, planning and health priorities. Yet, in 2021, in sub-Saharan Africa, few countries benefit from reliable and timely evidence on new births and information of who dies of what relying […]
Read More
Research Themes
Unmet need for COVID-19 vaccination coverage
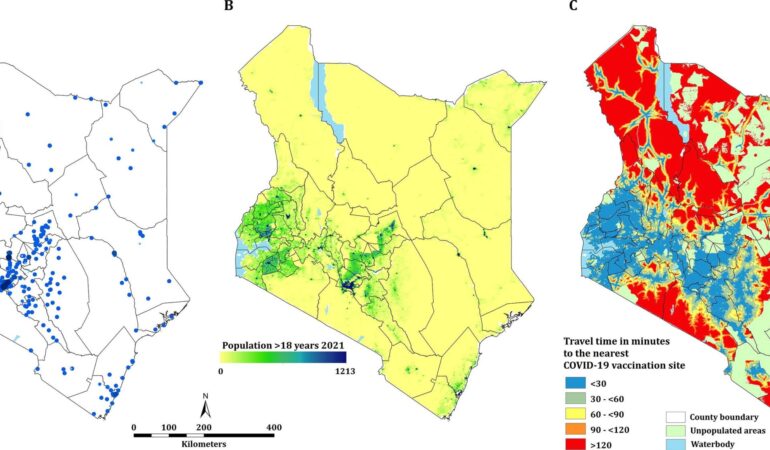
The average mean travel times to COVID-19 vaccination sites was found to be 75.5 minutes. Integration with population estimates showed an average of 87.2% of the adult population within an hour of a vaccination site. At national level, the coverage rate was 16.70% (95% CI 16.66 – 16.74) in December 2021 and 30.75% (95% CI […]
Read More
Research Themes
A vulnerability index for COVID-19
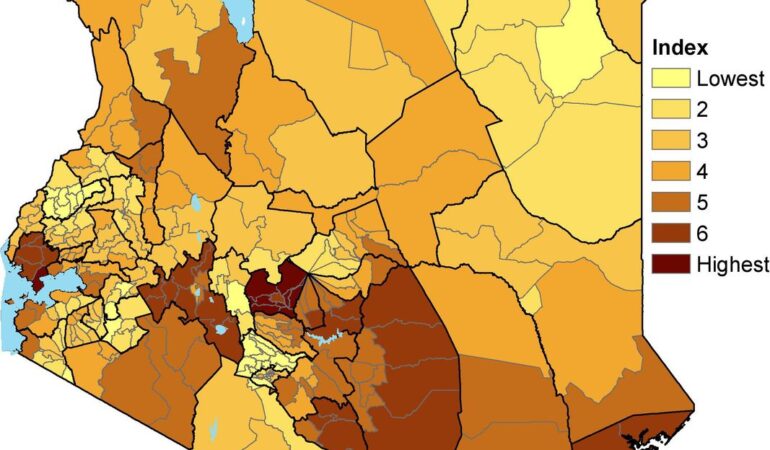
The study highlights the most vulnerable groups in the country and their geographic location. These groups provide an improved understanding of the population characteristics which will help when setting up interventions in response to COVID-19. Three vulnerability indices were used to identify the areas and people who require greater support while addressing health inequities in […]
Read More


Recent Comments